Patching between every possible combination of IWAD versions as fast as possible
Not too long ago I added an automatic test suite to Omniscient, my graphical Doom IWAD patching utility. This test suite performs every single permutation of patches, and outputs the results in a JUnit XML file. Wired up to my Jenkins instance this allows me to spot when I break stuff pretty quickly, and is especially useful in determining when specific patches break.
There’s a problem however: there are almost 900 possible patches that can be performed. Some of these patches are actually multi-step patches as well. And as you can imagine, this can take a while. On my Ryzen 9 5900X, it takes around 1 minute and 25 seconds to run all the tests. The Jenkins node uses a Windows Server 2022 virtual machine with 2 cores running on a Xeon E3-1270 v6 machine that runs a bunch of other crap as well, and in this VM it takes about 2 minutes to run all the tests. Okay, not terribly long, but it’d be nice to get it faster…
Fortunately, the test suite code was very easy to multi-thread. It already assembled a list of IWAD pairs to patch between, and the patching code doesn’t rely on any global state other than the list of results, so it was easy enough to tear the loop out into its own function and add a mutex lock around that one shared data access.
After adding the multithreading, the test suite takes only ~12 seconds to run on my 5900X when using 24 threads - just over seven times faster. Unfortunately, I don’t know enough about CPUs or profiling to figure out why it isn’t at least 12x faster (I doubt it could reach 24x as half the logical cores because of simulatenous multithreading/hyperthreading.) On the Jenkins virtual machine, it takes around 1 minute to run the tests, so a much more predictable 2x speedup.
I decided to turn this into a benchmark, writing a simple Python script that runs the tests with a minimum and maximum amount of threads, running each three times and generating an average for each number of threads. Here’s a graph of the results of running that on my 5900X:
[Removed, this was a Google Sheets chart embed, but I apparently deleted the original sheet from my Google Drive. I’m an idiot, sorry.]
Unfortunately, as I already said, I don’t know enough about how CPUs work or profiling to explain that curve.
Interesting, however, that after >56 threads, three times the actual number of threads my CPU has, it shaves off about two seconds.
(This line of thought also lead me to discover that WaitForMultipleObjects only supports up to 64 objects - fortunately using WaitForSingleObject in a for loop gets around this limit.) I also discovered a crash bug as the thread count reaches about 256 threads.
I was reading old The Old New Thing posts a while ago and thought it could be a similar issue to this, but Omniscient doesn’t use anywhere near that much memory.
Not too worried about this one though, 256 threads is a bit excessive.
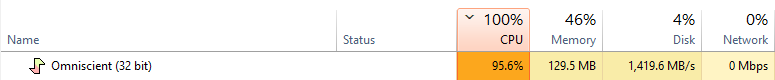
Only 4% disk?
Another thing to note is the sheer amount of disk activity the program uses multithreaded. Each test involves reading at least one patch file from the executable and the IWAD to patch to, and writes a patched WAD at least one. Some cases involve multi-step patches: for example, patching Doom v1.1 to shareware v1.1 will require going from Doom v1.1 -> Ultimate Doom v1.9 -> shareware v1.9 -> shareware v1.1 - three patches. This is done to reduce the number of permutations of patches, which reduces space in the executable. Each step is written to and then read from a temporary file that gets immediately deleted after use. Hopefully this doesn’t leave the filesystem cache, otherwise I’ve thrashed the hell out of my SSD.
You might’ve also spotted an optimisation there: each thread has a list of IWAD pairs, but each such pair might have multiple steps of patches. It would be best to split the work between threads based on the total patches to be done, not the IWAD pairing. But currently this is a lot better than it was when single-threaded.
On the back of this work I decided to make patching from the actual application run on a separate thread instead of the UI thread. Patching happens fast enough that nobody is likely to notice unless it’s being run on an absolutely archaic machine - which it might be, Omniscient supports Windows 98!
Bonus bit: Jenkins will display the total time of each test as the time taken for the entire suite, instead of the time value specified in the JUnit XML file. As a result, we end up with tests that appear to take longer to run than the job they were run in:


Bonus bit 2: there was a race condition in the code that caused tests to randomly fail. Can you spot it?
TString GetTemporaryFilePath()
{
    static unsigned int i = 0;
    TCHAR tmpdir[MAX_PATH];
    TCHAR buf[MAX_PATH];
    time_t now = time(NULL);

    GetTempPath(MAX_PATH, tmpdir);
    _sntprintf(buf, MAX_PATH, TEXT("%somn_%u_%u.tmp"), tmpdir, i, now);
    i++;

    return buf;
}
The answer is that i wasn’t atomic, so a race condition would occur where two thread would try to open the same file, and the one that wasn’t first would fail.
The fix was to use InterlockedIncrement to access and increment the counter - can’t use C++11 atomic as I’m using Visual Studio 2005…